CloudWatch acts as a centralized logging collection repository for both system- and application-level logs generated by all of your devices and services and also external services running in your data center with the installation of the CloudWatch logs agent. By centralizing logging into CloudWatch, you have a central repository of all logs generated by all your resources and displayed in a central console, API, SDK, or CLI interface.
CloudWatch Logs can be processed as a complete picture of your operations and not just at the device or application level. This correlation ability gives you not only ongoing visibility but the ability to perform capacity planning and resolve issues as they arise. The logs are collected, combined, and displayed in the web management interface, as shown in Figure 5.4.
CloudWatch can collect log files in many different formats that are generated by dissimilar systems.
Log groups are configured to group log data into similar groupings such as Route 53 logs or load balancing logs. Multiple streams are then sent to each log group. By using the insights search feature, you can create expressions to find the log files of interest. A nice feature of insights is that it can monitor in real time and find new logs that match the filter expressions you define. Based on the match, you can trigger events to generate alerts or call other applications using automation to resolve any issues.
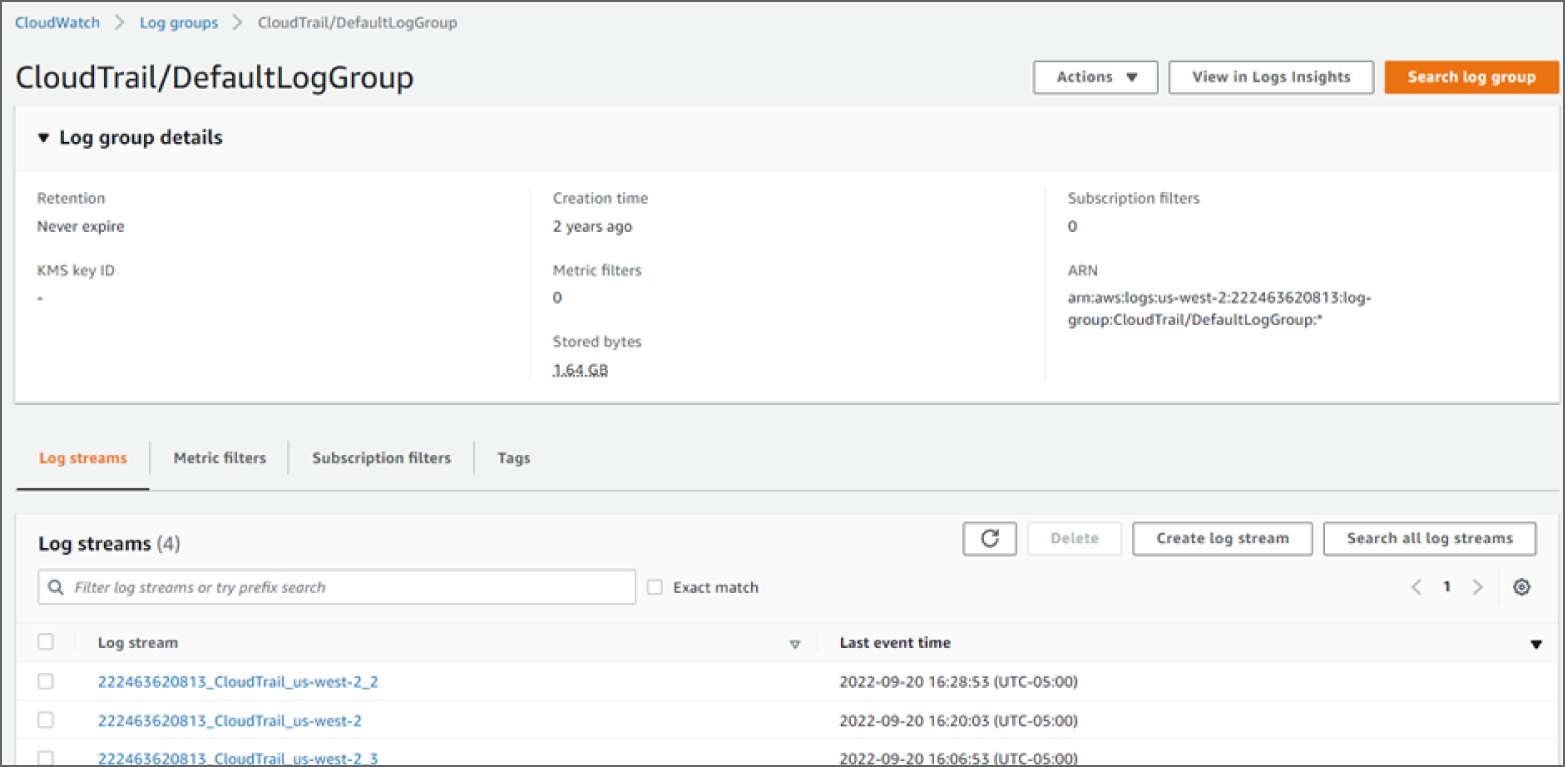
FIGURE 5.4 CloudWatch log groups
Logs are stored indefinitely and can be exported to S3 with life-cycle management configured to reduce retention costs.
Alarms generated by CloudWatch are based on metric conditions, configured thresholds, and log triggers that are defined. These events can trigger notifications to external tools and services. These services can perform actions using automation to notify support personnel using the SNS service, as shown in Figure 5.5. Alarms are configured based on metric values and data patterns in the log files.
CloudWatch alarms are structured to track a condition over a defined time window and then to generate an action. For example, you measure the number of active connections on a web server over a 15-minute interval and add another web server using autoscaling if the connection value exceeds 800 connections. Another example would be to monitor the log files generated by a web server and track 404 errors with 50 errors in a 10-minute window. The action could be to send an alert to the web administrators using the SNS.
Using AWS Lambda microservices gives you a great deal of flexibility to customize alarm actions. You could call a Lambda instance to forward logs to a data lake or Kinesis services to run queries for security intrusions or any other anomalies you track. Lambda can forward data to S3, DynamoDB, and many other services for further processing or storage.
Alert notifications can be configured to call the AWS SNS, which sends the alert to subscribers of the topic and can be used to trigger other downstream services such as SQS, email, and SNS text messaging. This push-based service is real time, which allows for quick response to process events.
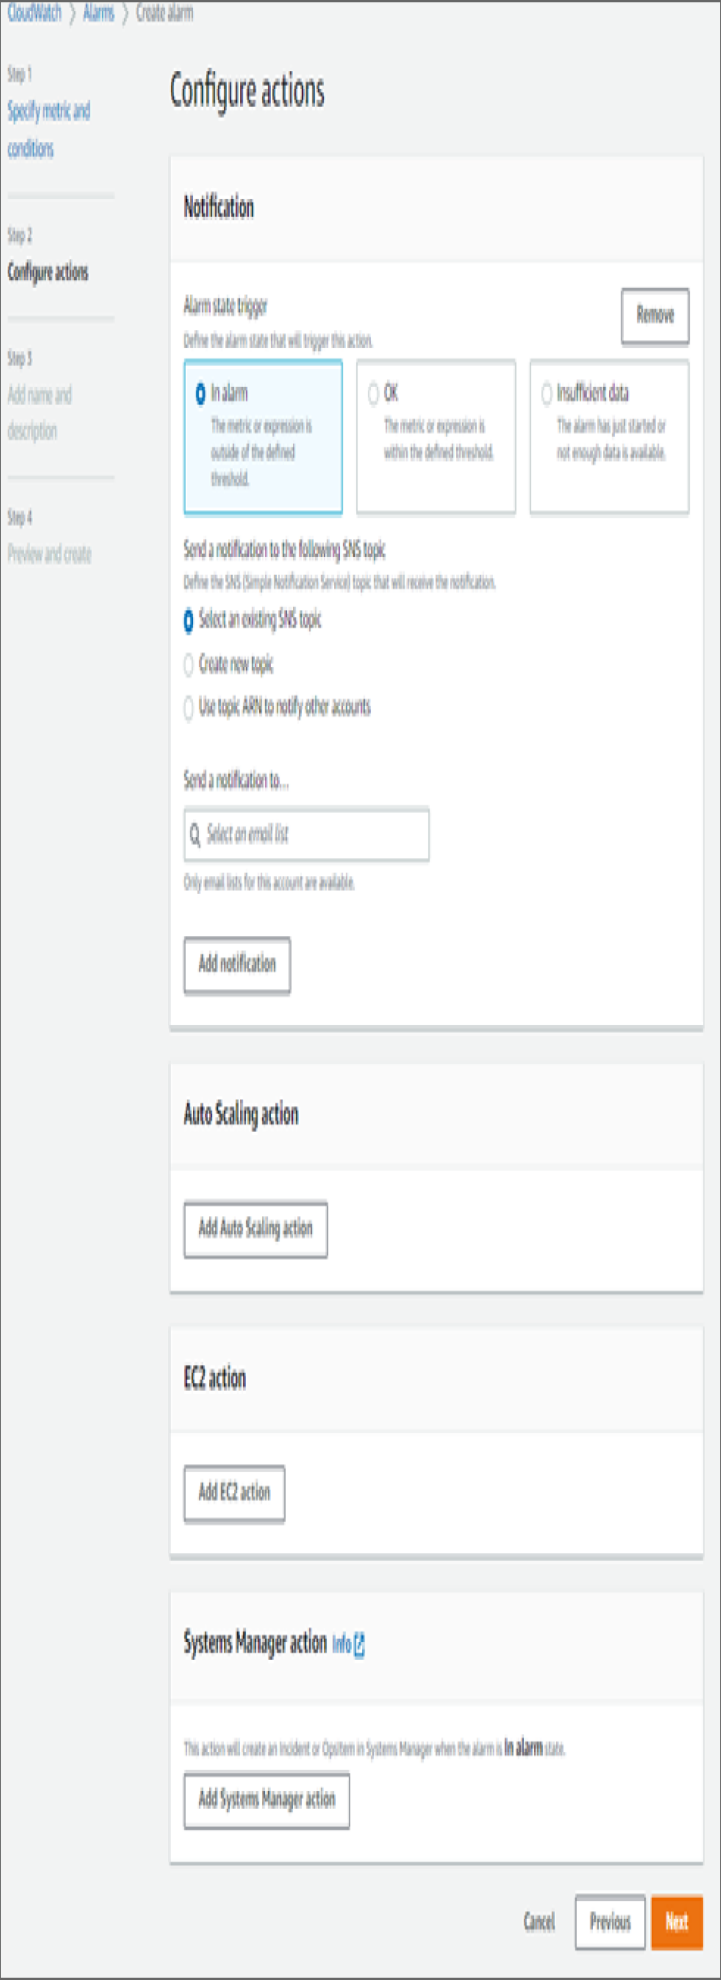
FIGURE 5.5 CloudWatch alarms configuration screen
Autoscaling events can be called from CloudWatch alarms. For instance, if a EC2 instance should fail, the alarms from CloudWatch can call an autoscaling group to replace the failed instance without user intervention. Other autoscaling operations include DynamoDB capacity RCUs/WCUs.
Billing alarms are included with CloudWatch to proactively monitor your charges and send out SNS alerts if they exceed your estimated charge limits. These can be forward looking with trending costs estimating future expenses and alerting you to take action before an unexpectedly large bill arrives.
Acedexam Training Policies
Learning resources
Other resources
Our Training Providers